Blog / Page 5
Blog
Playbooks, product updates, and sales-ops guidance for high-velocity teams.
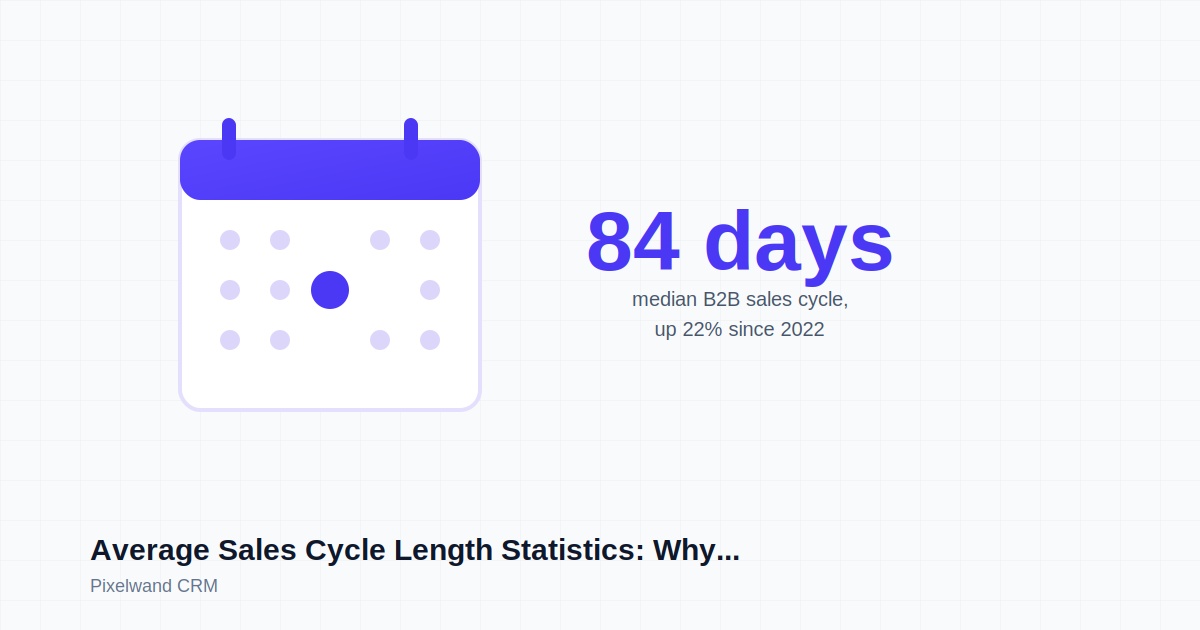
Sales Cycle Length: Median B2B Deal Takes 84 Days
Average sales cycle length statistics: the median B2B deal takes 84 days, up 22% since 2022, and deal size explains only 27% of the variance.
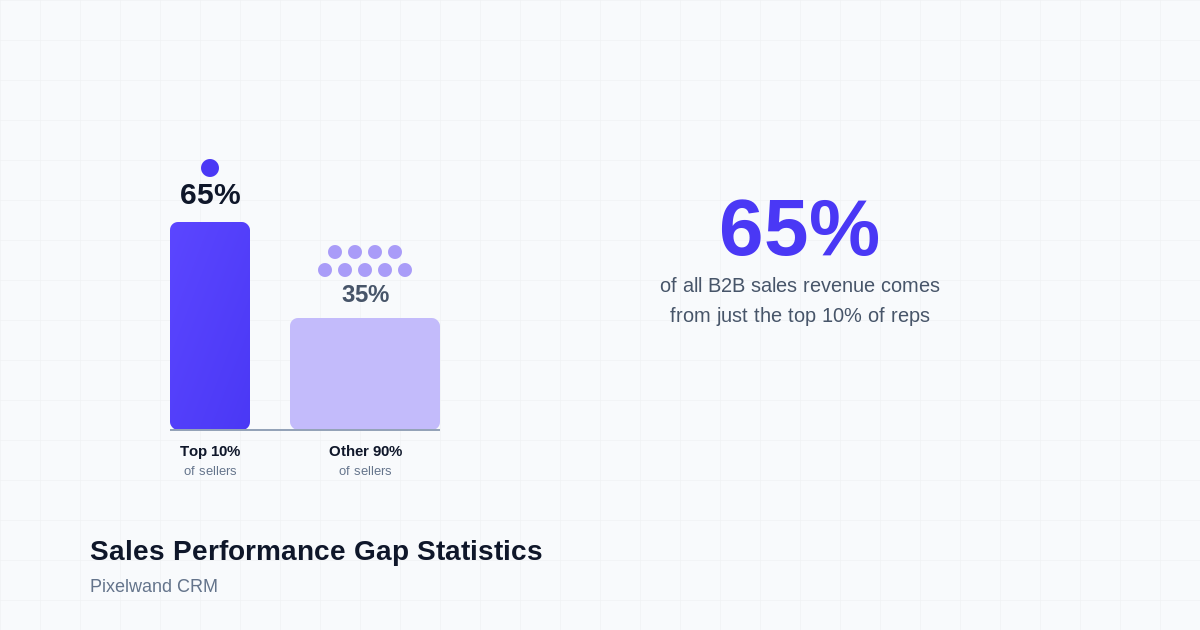
Sales Performance Gap: Top 10% Drive 65% Revenue
Clari analyzed 10M opportunities: the top 10% of sellers generate 65% of revenue while the bottom half contributes under 8%.
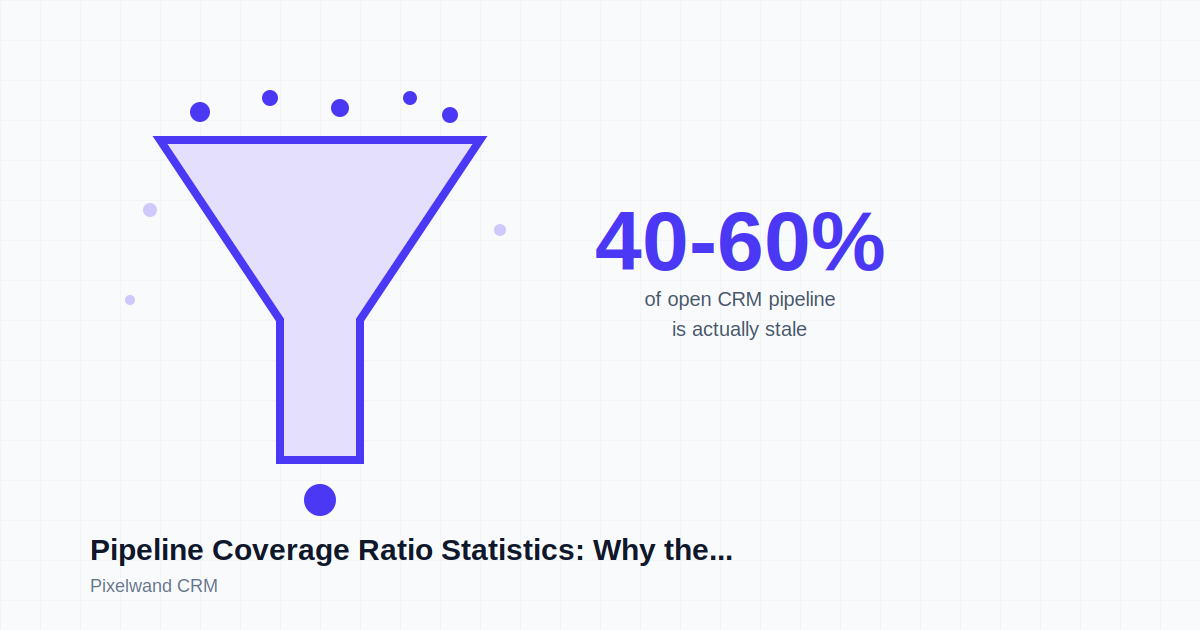
Pipeline Coverage: Why the 3x Rule Fails B2B Teams
Pipeline coverage stats: the classic 3x rule misfires once win rate, aging, and data quality factor in, with teams needing 2x to 6x.
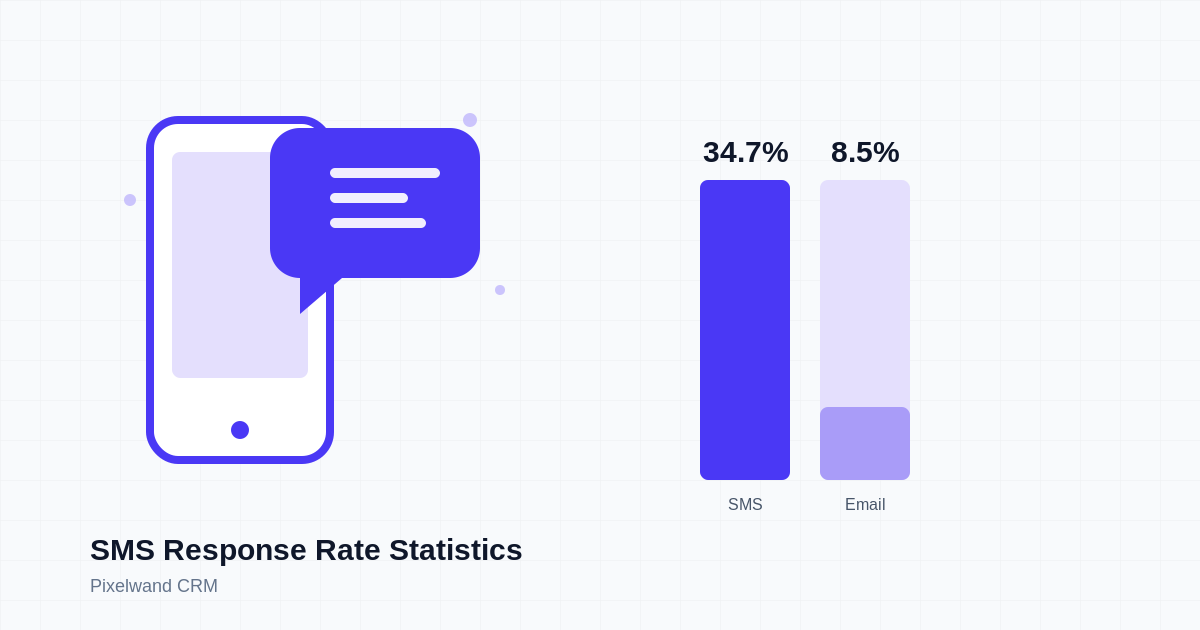
SMS Response Rate: Texts Beat Email 4-to-1 in B2B
TextUs surveyed 763 revenue pros: SMS earns 34.7% response versus 8.5% for email, yet top texting funnel stages get used least.
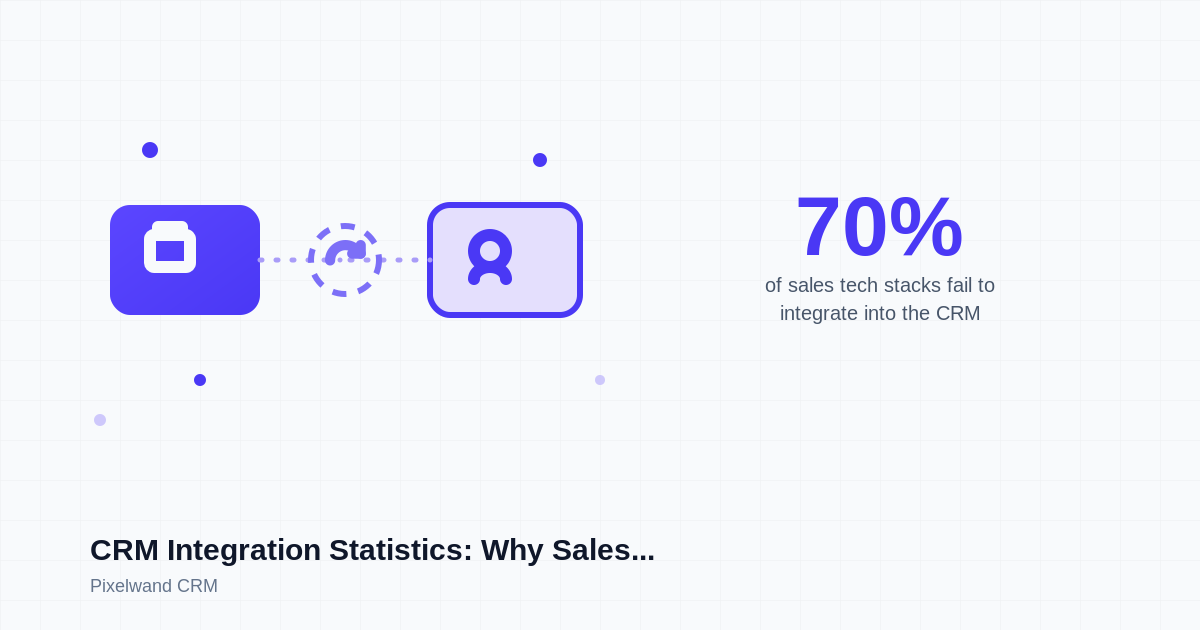
CRM Integration: 70% of Sales Stacks Don't Sync
70% of companies fail to integrate sales plays into CRM and revenue tech, and 99% of RevOps teams fight data issues. Here's what the data shows.
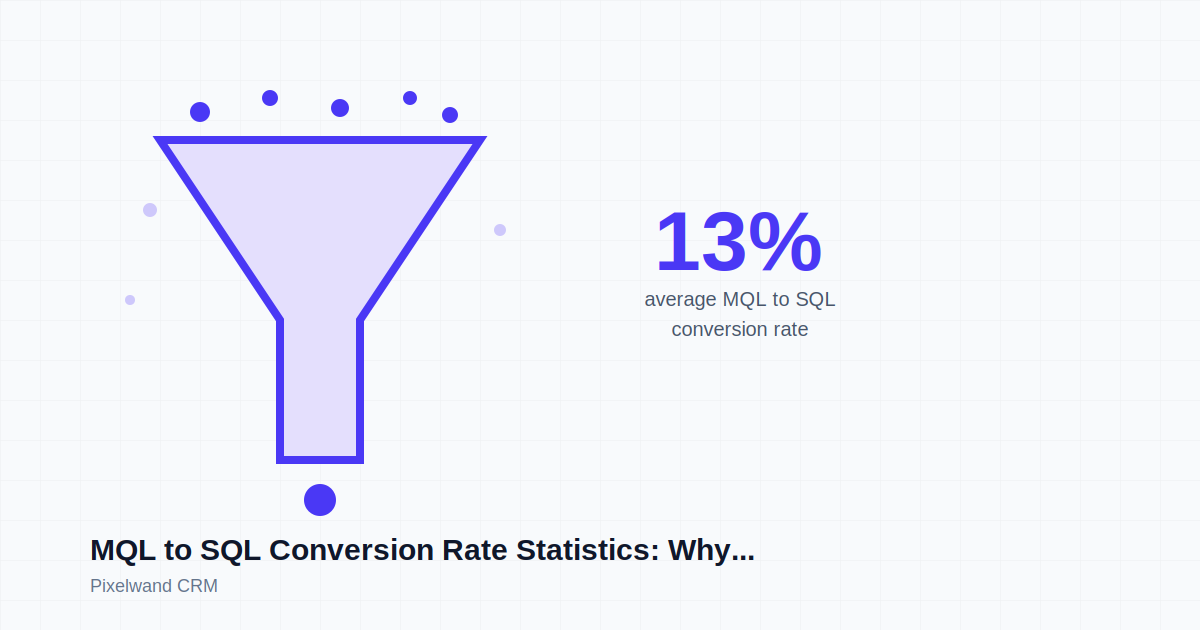
MQL to SQL Conversion: Only 13% Survive to Sales
The average MQL to SQL conversion rate sits at just 13%, but the real range runs from 10% to 51% depending on industry, channel, and how fast reps respond.
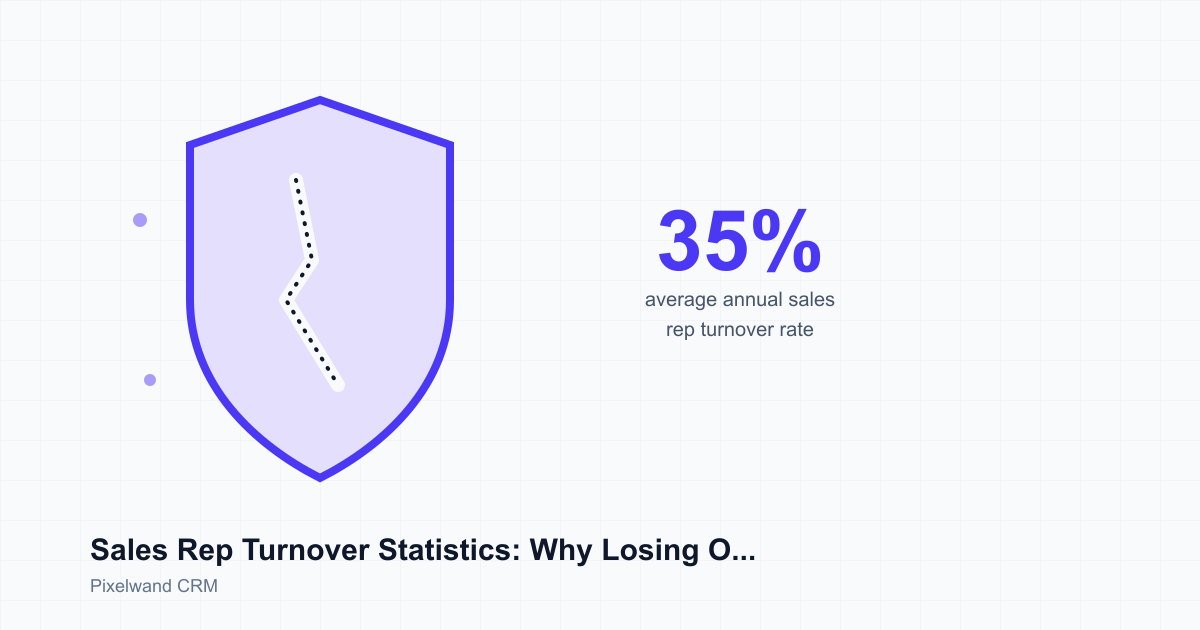
Rep Turnover: Losing One Rep Costs Over $115K
Rep turnover stats: reps leave at 35% a year, nearly triple the average, and each departure can cost $115,000 to $150,000 in pipeline.
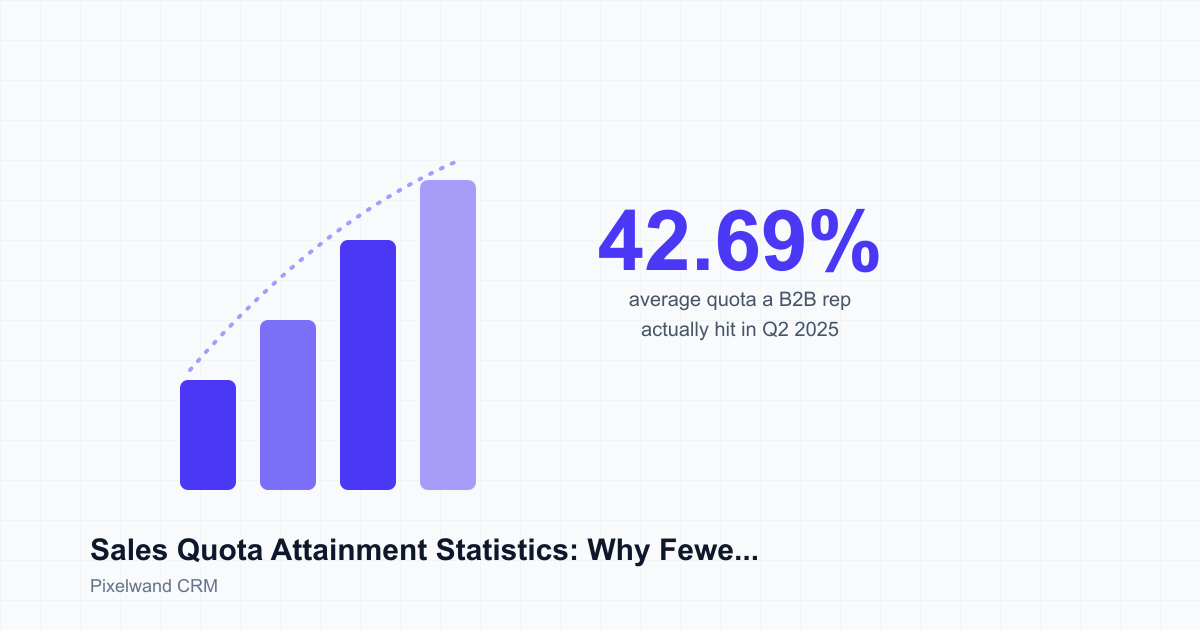
Quota Attainment: Fewer Than Half of Reps Hit Number
Quota attainment stats: average B2B reps hit just 42.69% of quota in 2025, down from 53% in 2022. Here's what moves the number.
Lead Leakage: 27% of Leads Never Get a Response
Lead leakage statistics: up to 27% of leads never get a response and unmanaged leakage can hit 80%. Fragmented channels are usually the cause.
CRM ROI Statistics: Return Fell $8.71 to $3.10
CRM ROI statistics: average return per dollar dropped from $8.71 to $3.10 over a decade, and adoption, not software, is the reason why.
Rep Ramp Time: Nearly 5 Months to Productive
Sales rep ramp time statistics show new hires need 3 to 5.7 months to reach full productivity, and slow ramps now cost companies over $114,000 per replacement.
What Is a CRM? Plain-English Guide for 2026
A CRM tracks every lead, deal, and customer conversation in one place. Here's what it does and why 91% of companies with 10+ staff run one.
Showing 12 of 79 articles · page 5 of 7