CRM ROI Statistics: Return Fell $8.71 to $3.10
CRM ROI statistics: average return per dollar dropped from $8.71 to $3.10 over a decade, and adoption, not software, is the reason why.
TL;DR: CRM ROI statistics tell an uncomfortable story. Nucleus Research, the analyst firm that has tracked CRM return on investment through real case studies since 2011, now puts the average return at $3.10 for every $1 spent, down from a widely quoted $8.71 in 2014, a decline of about 37% over a decade. The software did not get worse. Adoption did. Separate benchmark data shows organizations with strong CRM adoption see payback roughly 3 times higher than average, which means the ROI gap is sitting inside your own pipeline, not in the vendor's roadmap.
Where did the $8.71 ROI number come from?
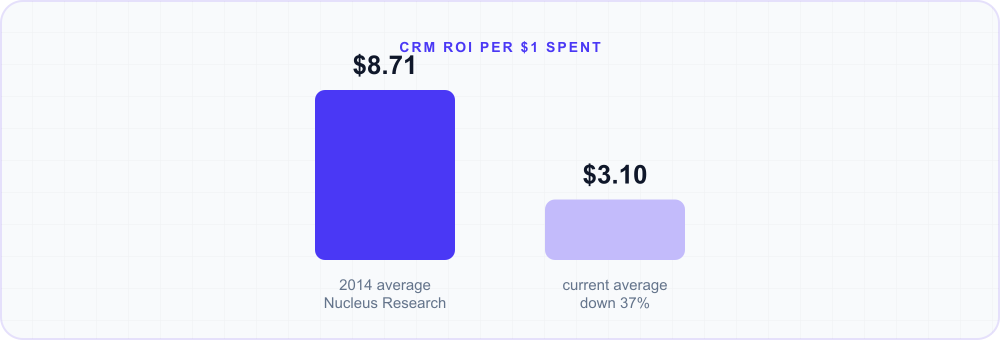
If you have ever sat through a CRM sales pitch, you have probably heard some version of "companies earn $8.71 back for every dollar they spend." That figure is real, and it comes from Nucleus Research, which analyzed its library of CRM ROI case studies and found average returns had climbed from $5.60 per dollar in 2011 to $8.71 by 2014. It became the most-cited stat in the entire CRM industry, repeated in vendor decks, analyst reports, and blog posts for the better part of ten years.
The problem is that the number is over a decade old, and CRM buying behavior has changed since then. Nucleus revisited the question by re-examining 63 case studies completed over the following decade, and found the average realized return had fallen to $3.10 per dollar spent, a 37% decline from where it stood earlier in that period. That is still a strong return by software standards, but it is a very different number than the one still floating around in most sales conversations.
Where is your CRM return really going?
Here is the part that should change how you think about CRM value. When Nucleus broke down where that $3.10 actually comes from, time savings from individual productivity gains and improvements to overall process efficiency accounted for 51% of the total ROI. Increased revenue, the benefit most people assume is the whole point of buying a CRM, was found to be the benefit area contributing least to the total return.
In other words, the biggest financial win from a CRM is not closing more deals directly, it is removing the friction that eats a rep's day: manual data entry, switching between five tools to log one interaction, chasing down which email thread a lead came from. A separate industry survey, the CRM Benchmark Report, put average CRM ROI at 211%, and found that figure could climb to roughly 3 times higher for organizations with strong adoption and utilization, which lines up with the same underlying story: the software's ceiling is high, and the gap between the ceiling and what most teams actually capture is an adoption problem, not a features problem.
Why does ROI jump only after 71% adoption?
This is the statistic that should matter most to any sales leader building a business case. The same CRM Benchmark Report analysis found that 71 to 80% user adoption was the breakpoint where financial return shifted from incremental growth to linear growth, and organizations with both high adoption and high software utilization achieved payback roughly 3.1 times higher than the average respondent.

That is a striking threshold. It means a CRM sitting at 50% adoption is not halfway to the value of a CRM at 100% adoption, it is disproportionately behind. Reps who only log calls sometimes, only use the pipeline view occasionally, or keep a second spreadsheet "just in case" are not getting a partial return, they are keeping the organization below the point where ROI compounds. Nucleus's own explanation for the falling $8.71-to-$3.10 trend backs this up: as CRMs have added more modules, integrations, and AI capability, the gap between what the system can do and what reps actually touch has widened, and unused capability does not show up on anyone's P&L as a loss, it just quietly caps the return.
How long it actually takes to break even?
Payback period estimates vary by source and by how aggressively a company implements. Broader industry guidance points to most businesses recovering their CRM investment somewhere between 6 and 18 months, with some individual Nucleus case studies showing payback in as little as a few months when adoption and process change happen fast, and others taking well over a year when they don't. The pattern across nearly every source is the same: the software's cost is fixed and predictable, but the time to positive ROI is almost entirely a function of how quickly and completely people actually use it.
Curious how this looks with your own pipeline?
15-minute walkthrough, no pressure, cancel anytime.
Where Pixelwand CRM fits in
The Nucleus Research data is basically a roadmap for what erodes CRM ROI: reps who avoid the tool because logging an interaction is extra work, and revenue teams who never get the productivity gains because activity lives in five different apps instead of one record. Pixelwand CRM is built around closing exactly that gap. Calls, WhatsApp messages, web form leads, and email all land automatically on the same lead or deal record, so there is no separate step where a rep has to remember to log anything.
Native calling through Twilio puts click-to-call directly on the record, two-way WhatsApp Business API messaging sits attached to the deal instead of living in a separate app on someone's phone, and Gmail and Outlook sync auto-logs email threads and calendar events without a rep touching a keyboard. Slack notifications and Google Calendar sync with meeting-prep summaries mean the information reps need shows up where they already are, rather than requiring a trip into the CRM to go find it. None of that changes what a CRM can theoretically do. It changes how much of that capability actually gets used, which, according to the same research behind the $3.10 figure, is the single biggest driver of whether your CRM investment lands closer to the ceiling or closer to the average.
Sources: Nucleus Research: CRM returns $3.10 per dollar spent, Nucleus Research: CRM benefit areas with the greatest ROI impact, Nucleus Research: CRM pays back $8.71 for every dollar spent, Nucleus Research: CRM Returns $5.60 for Every Dollar Invested, CRM Search: What's the ROI for CRM?
Why reps skip CRM: manual data entry. Only 37-72% use it as intended, even when 91% of companies own one. Here's what the data shows.
CRM data breach statistics show third-party involvement doubled to 30% in 2025, and breaches now cost $4.44 million on average.
Sales call prep stats: reps who research 15+ minutes win 50% more deals, yet only 49% of average sellers research consistently.
Frequently asked questions
What is the average ROI of a CRM?
Nucleus Research, which has tracked CRM return on investment through case studies since 2011, currently puts the average return at $3.10 for every $1 spent. That is down from a widely cited $8.71 figure from 2014 and $5.60 in 2011, a decline of roughly 37% over the decade. A separate CRM Benchmark Report survey puts average ROI at 211%, with returns climbing to roughly 3 times higher for organizations with strong software adoption and utilization.
How long does it take for a CRM to pay for itself?
Most businesses report a payback period between 6 and 18 months, depending on implementation complexity and how quickly reps actually adopt the tool. Individual case studies vary widely: some organizations recover their investment in as little as 2 to 6 months, while others take well over a year if training and adoption lag.
Why is CRM ROI declining if the software keeps improving?
Nucleus Research's own analysis attributes the drop mainly to underuse, not weaker technology. As CRMs have added more modules, integrations, and AI features, the gap between what a system can do and what reps actually do inside it has widened, and that unused capability is exactly what erodes the realized return.
Does CRM adoption rate actually affect ROI, or is that just a talking point?
It shows up directly in the data. One CRM Benchmark Report survey found that 71 to 80% user adoption was the breakpoint where financial return shifted from incremental to linear growth, and organizations with both high adoption and high utilization achieved payback roughly 3.1 times higher than the average respondent.