Pipeline Coverage: Why the 3x Rule Fails B2B Teams
Pipeline coverage stats: the classic 3x rule misfires once win rate, aging, and data quality factor in, with teams needing 2x to 6x.
TL;DR: Pipeline coverage ratio statistics expose a costly assumption baked into most sales forecasts: the "3x rule." Teams with a 50% win rate really only need about 2x coverage, while enterprise teams closing 15% to 20% of deals need 5x to 6x, and none of it matters if 40% to 60% of what's sitting in the CRM is stale pipeline that was never going to close anyway. Coverage is a math problem before it's a motivation problem, and most teams are doing the math wrong.
What pipeline coverage ratio actually measures?
Pipeline coverage ratio is one of the simplest formulas in sales operations: total qualified open pipeline value divided by the quota or revenue target for the same period. If a team has 1.5 million dollars in qualified pipeline against a 500,000 dollar quarterly quota, the coverage ratio is 3x. For decades, sales leaders have treated 3x as gospel, the number every VP quotes when asked whether a team has "enough pipeline" to hit the number.
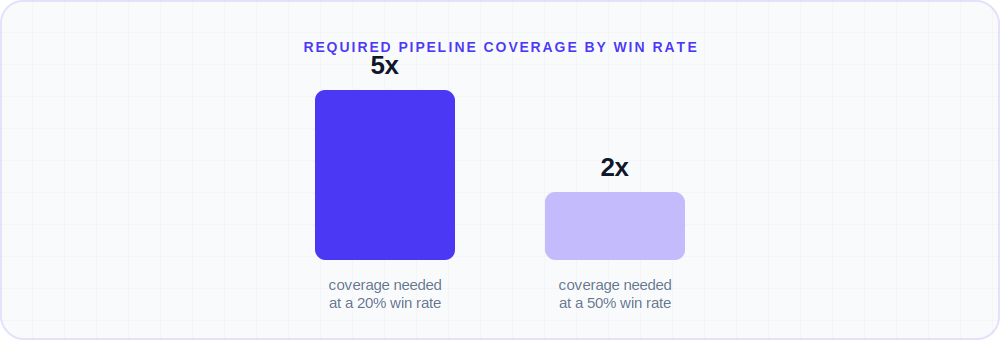
The problem is that the 3x rule was never really a universal law. It's a shortcut that assumes every team closes roughly a third of its qualified opportunities. Divide 1 by your win rate and you get your true required coverage: a team converting 33% of deals needs 3x, but a team converting 25% needs 4x, and a team converting 20% needs 5x just to have a mathematical shot at the number. Clari's research on this puts it plainly: teams closing 20% of opportunities need 5x pipeline to reliably hit target, not the borrowed 3x figure most orgs still plan around.
Why does coverage math fail across segments?
Real win rates vary enormously by segment, and that variance is exactly where the 3x rule breaks. SMB teams with fast cycles and win rates around 60% only need roughly 1.7x to 2x coverage; demanding 3x from them just creates artificial urgency and wastes energy chasing pipeline they don't need. Enterprise teams with longer cycles and win rates closer to 15% need 5x to 6x coverage, and accepting 3x as "good enough" all but guarantees a missed quarter. Separate win-rate benchmark data backs up how wide that spread is in practice: the average B2B win rate sits around 21% across all opportunities but climbs to 29% once you count only properly qualified deals, and enterprise deals above 100,000 dollars in annual contract value see median win rates of just 15% compared with 31% for SMB deals.
That 8-point gap between all-deals and qualified-only win rates matters because it represents opportunities that should never have entered the pipeline in the first place, deals that consumed rep time and CRM space without a realistic chance of closing. A 2025 benchmarks report from Fullcast found that high-fit, ICP-aligned accounts make up only 23% of total pipeline at many organizations, meaning the vast majority of what shows up in a coverage calculation isn't the kind of deal that's actually going to close.
How does stale pipeline inflate your coverage?
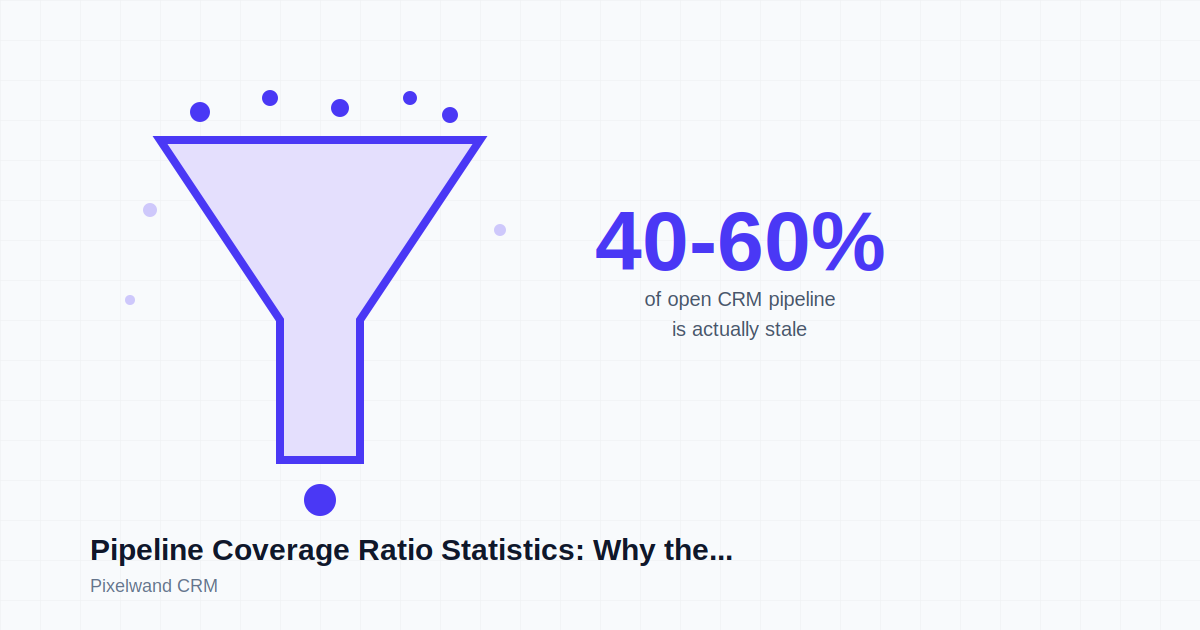
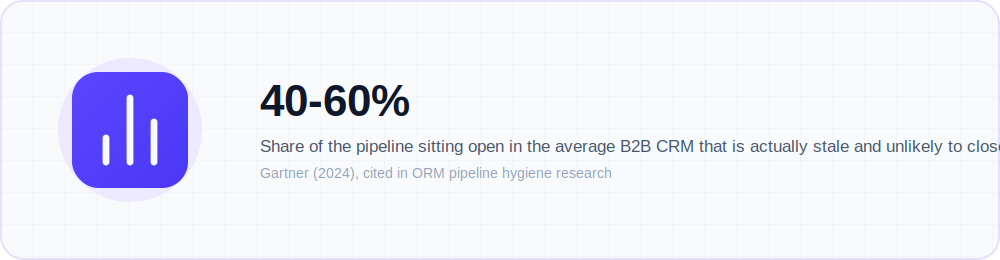
Even a perfectly calculated, segment-specific coverage ratio is only as good as the pipeline underneath it, and that's where the numbers get uncomfortable. Pipeline hygiene research citing Gartner puts the share of stale pipeline in the average B2B CRM at 40% to 60%, meaning nearly half of what looks like "coverage" on a dashboard is fiction. Separate research on deal aging estimates that the average B2B pipeline contains 20% to 40% dead or dying deals that nobody has formally closed out, deals sitting for 90, 120, or 180 days that keep getting pushed to "next quarter" without anyone questioning whether they belong in the funnel at all.
This is why coverage ratios that look healthy on paper so often produce forecast misses in practice. A Forrester Consulting study commissioned by Clari, surveying more than 300 software industry revenue operations decision-makers, found that 85% of B2B companies miss their monthly sales forecast by more than 5%, and 51% miss by more than 10%. CSO Insights research puts a similar number on the deal level: only 46% of B2B opportunities forecasted to close actually do so as expected. None of that is a coincidence when a team's "3x coverage" quietly includes deals that were never going to close.
Why won't a bigger ratio fix your coverage?
Cleaning up what actually counts as qualified pipeline changes the picture more than chasing a bigger multiple ever will. InsightSquared research found that clean pipeline produces forecasts that are 23% more accurate than pipelines with hygiene problems, and one pipeline-management analysis found that reps who start a quarter with 3.2x or more in weighted, qualified coverage hit quota 89% of the time, while reps starting below 2.8x see quota attainment fall to just 52%. The gap between those two outcomes isn't about working harder in the last two weeks of the quarter, it's about whether the pipeline number a team is planning against was ever real.
That's a data problem as much as a sales-motion problem. A coverage ratio calculated from a CRM where deals sit untouched for weeks, contacts go stale, or the same account gets logged twice under two different names will always look better than the business actually is.
Curious how this looks with your own pipeline?
15-minute walkthrough, no pressure, cancel anytime.
Where Pixelwand CRM fits in
A coverage ratio is only honest if the activity feeding it is current, and that comes down to whether reps are actually logging what's happening on each deal. Pixelwand CRM unifies leads and deals from calls, WhatsApp, web forms, and email into one pipeline automatically, so a deal doesn't look "active" just because nobody remembered to update its stage. Native calling through Twilio with click-to-call from the deal record, plus two-way WhatsApp Business API messaging attached directly to that same record, means every touch gets captured where the coverage math actually lives instead of scattered across separate apps. Gmail and Outlook sync auto-logs email threads and calendar events on the record too, closing one of the most common gaps that lets a dead deal keep looking alive. Custom statuses and assignment rules make it easier to flag deals that haven't moved, and Slack notifications keep managers aware of stalled or reassigned opportunities in real time, so a coverage ratio built on Pixelwand data reflects what's actually happening in the pipeline, not what the CRM assumed six weeks ago.
Quick answers
Set coverage as 1 divided by win rate. A 50% win rate needs about 2x, while a 20% rate needs 4x to 5x, not a borrowed 3x.
Stale pipeline inflates the ratio. Roughly 40 to 60% of open pipeline is stale, so clean qualification before chasing a bigger multiple.
Weighted coverage predicts attainment. Reps starting above 3.2x qualified coverage hit quota far more often than those below 2.8x.
Sources: Clari, Landbase pipeline coverage guide, Landbase win rate benchmarks, rework.com pipeline coverage analysis, rework.com deal aging management, ORM pipeline hygiene glossary, Fullcast pipeline coverage ratios guide, Salesmotion win rate benchmarks 2026, nrev.ai sales pipeline analysis, Opla CRM win probability
Understand pipeline coverage ratio, how win rate changes the number, and how to turn a revenue target into a qualified pipeline plan for your team.
Learn the sales pipeline math behind a revenue target, from deals needed to leads and weekly activity, with a free calculator you can use now.
Pipeline velocity stats: average B2B win rate fell to 19% in 2025, and deals closing in 50 days win at 47% versus 20% slower.
Frequently asked questions
What is a good pipeline coverage ratio?
There is no single good number. Teams with a 50% win rate only need about 2x pipeline coverage, while teams with a 20% to 25% win rate need 4x to 5x. Most B2B organizations land somewhere between 3x and 5x, but the right target is 1 divided by your actual historical win rate, not a borrowed industry rule.
How do you calculate pipeline coverage ratio?
Divide your total qualified open pipeline value for a period by your quota or revenue target for that same period. A team with 1.5 million dollars in qualified pipeline against a 500,000 dollar quarterly quota has 3x coverage. The catch is that the ratio is only meaningful if the pipeline you are counting is actually qualified and current, not padded with stale deals.
Why doesn't the 3x pipeline coverage rule work for every team?
The 3x rule assumes roughly a 33% win rate for everyone, which almost no team actually has. SMB teams with 60% win rates only need 1.7x to 2x coverage, while enterprise teams with 15% win rates need 5x to 6x. Applying one ratio to every segment either creates false alarm for high-converting teams or false confidence for low-converting ones.
How much of a typical CRM pipeline is actually dead weight?
Research cited in pipeline hygiene studies puts stale, non-progressing pipeline at roughly 40% to 60% of what sits open in the average B2B CRM. Separate research on deal aging estimates 20% to 40% of pipeline is dead or dying but never formally marked closed-lost, which inflates coverage ratios without anyone noticing.