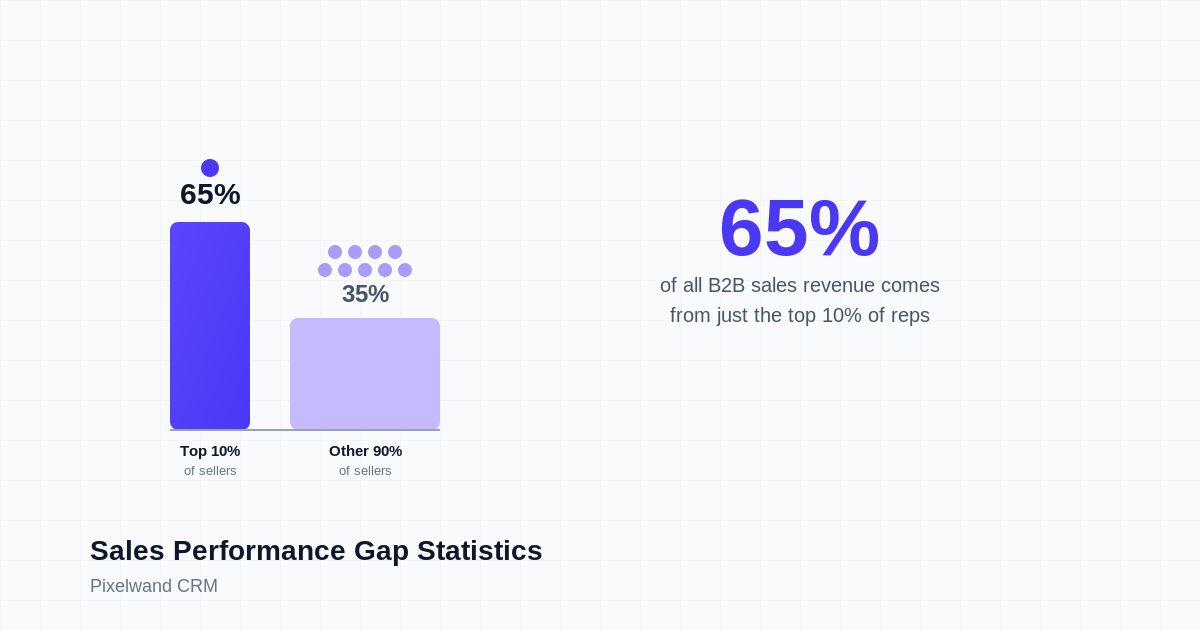
Sales Performance Gap: Top 10% Drive 65% Revenue
Clari analyzed 10M opportunities: the top 10% of sellers generate 65% of revenue while the bottom half contributes under 8%.
TL;DR: Clari Labs analyzed 10 million sales opportunities across more than 100 Fortune 500 companies and found the top 10% of sellers generate 65% of all revenue, while the bottom half of the sales force contributes less than 8%. A separate study from Ebsta and Pavilion, covering 655,000 opportunities worth $48 billion, found an even sharper split: 14% of sellers drive 80% of revenue, an 11x gap between top and bottom quartile performers. The gap isn't mostly talent. It's visible behavior, multi-threading, consistent follow-up, and early qualification discipline, that shows up in CRM activity data long before it shows up in a commission check.
Why did the 80/20 rule undersell sales concentration?
Every sales leader has some version of the 80/20 rule lodged in their head: a fifth of the team drives most of the revenue, the rest fill out the roster. It's treated as a rough, slightly cynical approximation, the kind of thing you nod at in a QBR without checking the actual math. The real numbers are more extreme than that shorthand suggests, and they've been getting more extreme, not less.
Clari Labs, the research arm of the revenue orchestration platform Clari, pulled 10 million anonymized opportunity records from over 100 de-identified Fortune 500 companies, covering every deal closed between Q1 2023 and Q4 2024, and analyzed each one across 33 parameters including rep, amount, close date, and closed-lost reason. The headline finding: the top 10% of sellers generate 65% of all revenue, while the bottom 50%, literally half the sales organization, contributes less than 8%. Narrow the lens further and it gets sharper still. The top 2% of sellers alone drive 37% of total revenue on their own.
Ebsta and Pavilion's 2025 GTM Benchmarks Report, built from 655,000 opportunities worth a combined $48 billion and survey responses from more than 2,000 CROs and sales leaders, arrived at an even more concentrated picture using a different dataset and methodology: just 14% of sellers drive more than 80% of revenue, an 11x performance gap between the top and bottom quartile. Two independently run studies, two different samples, and the same basic shape: a small slice of any sales team is carrying almost all of the number.

How concentrated is B2B sales revenue?
It's worth sitting with what "top 10% drives 65%" actually means operationally. On a 20-person sales team, that's two reps carrying roughly two-thirds of the number every single quarter, while the other 18 split what's left. Clari's own CEO, Andy Byrne, framed the finding bluntly in the report's release: "Will your team be part of the 2% that dominates revenue, or the 98% playing catch-up?" It's a pointed question, because a team this dependent on a couple of rainmakers isn't actually a repeatable revenue engine. It's a couple of individuals with a company attached.
The Clari data also complicates a comforting assumption that bigger, more complex deals simply take proportionally longer to close, which would at least explain some of the gap as a function of deal difficulty rather than rep skill. It doesn't hold up: deals worth $500,000 take only 15 days longer to close, on average, than deals in the $50,000 to $100,000 range. Whatever is separating the top 10% from the rest, it isn't primarily about who gets handed the easier deals.
What separates the top 10% from everyone else?
The Ebsta and Pavilion report gets specific about the behaviors underneath the gap, and none of them are exotic. Deals where a decision-maker gets engaged early see win rates jump 55% relative to deals where that engagement happens late or not at all. Sellers who build a C-suite engagement score above 40, essentially a measure of how much real interaction they're having with senior stakeholders rather than a single mid-level champion, see win rates increase by more than 400% relative to sellers who don't. Top performers are also 24% more likely to disqualify a deal that doesn't fit the ideal customer profile early, instead of letting it sit in the pipeline inflating coverage math for months.
None of that is a personality trait. It's a set of habits, mostly around who a rep talks to, how early, and how disciplined they are about walking away from the wrong deals, and every one of those habits leaves a trace in CRM contact and activity data. The report also found that top performers simply handle 164% more deals than the rest of the team, which tracks: reps who qualify faster and disqualify earlier free up the time to carry a bigger book in the first place.

Curious how this looks with your own pipeline?
15-minute walkthrough, no pressure, cancel anytime.
Why the gap doesn't close on its own?
If the behaviors that separate top performers are visible and specific, the obvious question is why more sales organizations haven't just coached the rest of the team into them. Clari's data points at a structural reason: only 25% of sellers complete their assigned sales tasks in the first place, and 98% of companies don't consistently track why deals are actually lost. Without that second data point, in particular, a sales org has no reliable way to tell whether last quarter's misses were about pricing, timing, a competitor, or a rep who never multi-threaded the account. The pattern just repeats.
Ebsta's research shows what that repetition costs in practice. Deals belonging to low performers are 217% more likely to slip at a late stage than deals belonging to top performers, and the report's own data on deal slippage shows how unforgiving that is: a deal that slips by about a week still closes around 18% of the time, but a deal that's been slipped for more than six months closes at only 3%. None of that is caused by the market getting harder mid-deal. It's what happens when a stalling deal doesn't get flagged and reworked while there's still time to fix it.
What moves a rep from the bottom half to the top quartile?
None of the behaviors above require a talent upgrade, which is the more useful way to read this data than as a verdict on who's naturally good at sales. A rep moving from the bottom half toward the top quartile is mostly a story of earlier qualification, more contacts engaged per deal, and follow-up that actually happens on the schedule it was supposed to happen on, not a story of charisma. The catch is that none of those things are visible from a stage name and a close date on a forecast call. They're visible in the underlying activity: who got contacted, how often, and how quickly a stalled deal got caught.
That's also why coaching so often fails to close the gap even when a manager genuinely tries. A 1:1 built around "how's the pipeline looking" surfaces opinions. A 1:1 built around actual contact counts, days since last activity, and how a deal's history compares to what closed-won deals looked like at the same stage surfaces facts, and facts are what change a rep's habits. The gap between the two is usually a data visibility problem before it's a coaching problem.
Where Pixelwand CRM fits in
Most of what separates a top-quartile rep from a bottom-half one in the data above never gets logged in a spreadsheet review, it lives in day-to-day activity that either lands on the CRM record automatically or quietly doesn't. Pixelwand CRM's Deal records support multiple linked contacts rather than a single point of contact, so a manager can see at a glance whether a rep is actually multi-threading an account or resting on one relationship, the exact behavior Ebsta's data ties to a 55% win rate lift. Because calling runs natively through Twilio and WhatsApp conversations sync through the WhatsApp Business API, those touchpoints land on the deal timeline automatically instead of depending on a rep to remember to log them, which is what makes contact counts and engagement patterns trustworthy in the first place rather than an undercount of whatever a rep bothered to write down.
The visibility extends to catching stalled deals before they become the 217%-more-likely-to-slip statistic. Custom Views let a manager build a saved filter for deals with no logged activity in the past two weeks, Service Level Agreements flag when a follow-up has gone past its window, and Assignment Rules make sure a hot lead doesn't sit unclaimed while a top performer could have worked it. None of this replaces coaching, but it gives a manager something concrete to coach against instead of a gut feeling about who's "just better."
If your pipeline reviews are mostly guesswork about who's actually multi-threading their accounts and who's letting deals go quiet, it might be worth seeing what that looks like with visible activity data instead.
Curious how this looks with your own pipeline?
15-minute walkthrough, no pressure, cancel anytime.
Sources: Clari, State of Enterprise Revenue Report, 2025 (press release via Business Wire), Ebsta and Pavilion, 2025 GTM Benchmarks Report.
Sales call prep stats: reps who research 15+ minutes win 50% more deals, yet only 49% of average sellers research consistently.
Rep turnover stats: reps leave at 35% a year, nearly triple the average, and each departure can cost $115,000 to $150,000 in pipeline.
Quota attainment stats: average B2B reps hit just 42.69% of quota in 2025, down from 53% in 2022. Here's what moves the number.
Frequently asked questions
What percentage of revenue do top sales performers actually generate?
Clari Labs analyzed 10 million opportunities from more than 100 Fortune 500 companies between Q1 2023 and Q4 2024 and found the top 10% of sellers generate 65% of all revenue, while the bottom 50% contribute less than 8%. Zoom in further and it's starker still: the top 2% of sellers alone drive 37% of total revenue. A separate 2025 GTM Benchmarks Report from Ebsta and Pavilion, built on 655,000 opportunities worth $48 billion, put the split even higher, finding that just 14% of sellers drive more than 80% of revenue, an 11x gap between top and bottom quartile performers.
What do top sales performers actually do differently from everyone else?
According to Ebsta and Pavilion's 2025 GTM Benchmarks Report, top performers engage decision-makers earlier in the deal, which boosts win rates by 55% relative to deals where that doesn't happen, and sellers who reach a C-suite engagement score above 40 see win rates increase by more than 400%. Top performers are also 24% more likely to disqualify a non-ICP deal early rather than let it sit in the pipeline, and the same report found top sellers handle 164% more deals overall than the rest of the team.
Why don't most sales organizations close this performance gap?
Mostly because the behaviors that separate winners from the rest never get captured or coached. Clari Labs found that only 25% of sellers complete their assigned sales tasks, and 98% of companies don't consistently track why deals are lost, which means the same mistakes repeat without anyone noticing the pattern. Ebsta's research adds a second angle: deals belonging to low performers are 217% more likely to slip at a late stage than deals belonging to top performers, and win rates drop sharply the longer a deal sits slipped.
Can CRM data actually help close a sales performance gap?
It can, mainly by making behavior visible instead of just outcomes. Whether a deal has more than one engaged contact, whether follow-ups are actually happening on schedule, and whether a stalling deal gets flagged before it quietly slips are all things that show up in CRM activity data long before they show up in a commission report, but only if that activity is actually being logged automatically instead of relying on a rep to type it in after the fact.