Pipeline Velocity: 50-Day Deals Win Twice as Often
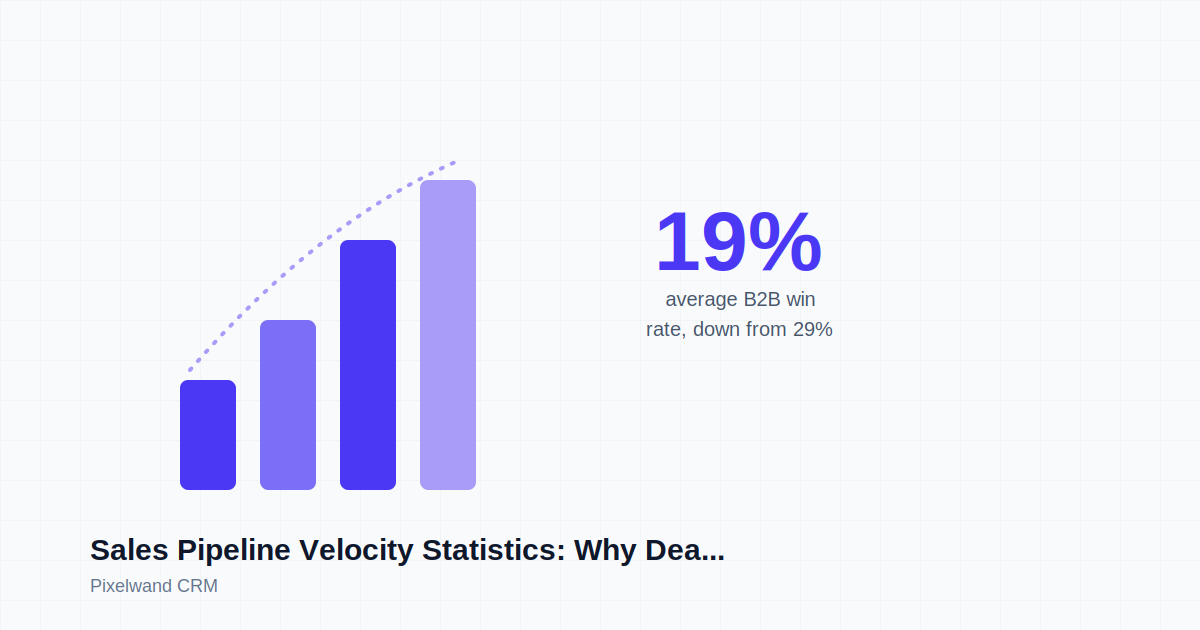
Pipeline velocity stats: average B2B win rate fell to 19% in 2025, and deals closing in 50 days win at 47% versus 20% slower.
TL;DR: Sales pipeline velocity statistics for 2025 paint a rough picture: the average B2B win rate fell to 19% (down from 29% the prior year), sales cycles have stretched roughly 22% since 2022, and deals that close within 50 days win at nearly 47% versus about 20% for deals that drag past that mark. Put those together and it's clear why so many teams feel like they're generating more pipeline than ever but closing less of it, faster generation without faster movement just produces a bigger pile of stuck opportunities.
What sales pipeline velocity actually measures?
Pipeline velocity is the metric that turns four separate sales numbers into one: how much revenue your pipeline is generating per day. The formula, used consistently across CRM and revenue-ops research, is Pipeline Velocity equals (Number of Opportunities times Average Deal Size times Win Rate) divided by Sales Cycle Length in days. It's a more honest measure of pipeline health than raw pipeline value or coverage ratio, because a pipeline can look full on a dashboard while quietly getting slower and less likely to convert underneath.
The reason it matters more this year than in past years is that all four inputs are moving in the wrong direction at once for a lot of teams. It's not just that deals are getting harder to win, it's that they're also taking longer to lose or win, which compounds the damage in a way a simple win-rate chart doesn't show.
Why are win rates falling as cycles stretch?
The clearest current data comes from the 2025 Ebsta x Pavilion GTM Benchmarks, an analysis of 655,000 opportunities worth $48 billion in pipeline. That study found the average B2B win rate fell to 19%, down from roughly 29% the year before, a market-wide compression tied to longer buying cycles and larger, more cautious buying committees. Separately, sales cycles have lengthened by around 22% since 2022 as buying groups have grown to six to ten decision makers per deal.
Worth noting: not every source agrees on the exact numbers. Another cut of the same Ebsta and Pavilion dataset, published by a different analyst, put the year-over-year win rate move at 21% down to 18% rather than 29% down to 19%, with cycles lengthening 12% rather than 22%. The direction is identical across every version, win rates down, cycles up, but the magnitude depends on which slice of the data and which time window gets quoted. That's a useful reminder that pipeline velocity benchmarks are directional signals, not numbers to chase to the decimal point.
Either way, the practical effect on velocity is the same. Since win rate sits in the numerator and cycle length sits in the denominator, a shrinking win rate combined with a growing cycle length hits velocity from both directions simultaneously, which is a big part of why so many revenue leaders describe 2025 and 2026 as feeling slower even when top-of-funnel volume looks fine.
Why 50 days is the line that separates winners from stalled deals?
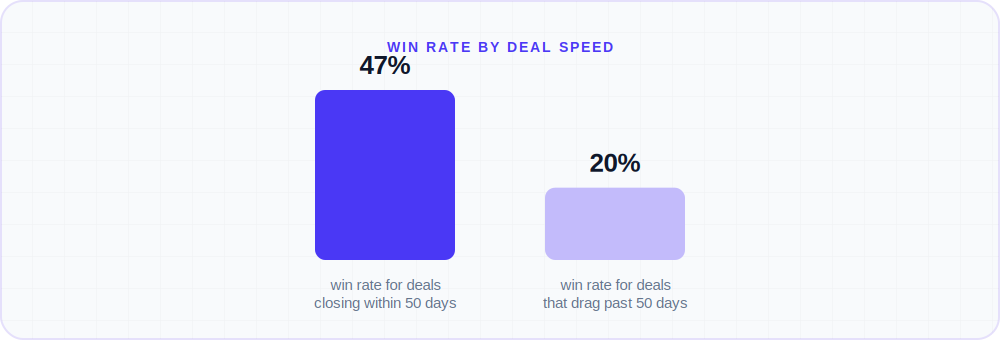
Here's the statistic that should change how sales teams think about speed. In the same Ebsta x Pavilion dataset, deals that closed within 50 days won at roughly 47%, more than double the roughly 20% win rate of deals that stretched past that mark. The same research found that delayed deals see win rates fall by about 113%, while getting the economic decision maker engaged early lifts win rates by around 55%.
That's a meaningfully different claim than "fast deals just look better in hindsight." It suggests speed itself is a win-rate driver, not simply a byproduct of deals that were always going to close. A Forrester study on B2B buying groups adds a mechanism for why: deals with three or more engaged contacts close about 30% faster than single-threaded deals, meaning the same multi-threading discipline that speeds a deal up also appears to be what keeps it from stalling out and dying quietly in negotiation.
Curious how this looks with your own pipeline?
15-minute walkthrough, no pressure, cancel anytime.
Why is the fast-vs-slow team gap structural?
If falling win rates and longer cycles are the headline problem, the scoreboard gap between teams is the part that should worry sales leaders most. Analysis built on the 2025 Ebsta x Pavilion benchmarks found that just 14% of sellers now drive 80% of revenue, and that top-performing sales teams generate roughly 11 times the pipeline velocity of bottom-performing teams. That gap isn't the product of one huge advantage, it's the compounding effect of small edges across all four velocity inputs at once: somewhat more qualified opportunities, somewhat larger deals, a handful of points higher win rate, and a shorter cycle. None of those differences look dramatic in isolation, but multiplied together they produce an order-of-magnitude gap in how fast revenue actually moves.

Segment context helps calibrate expectations too. One 2025 benchmark study of 423 B2B SaaS companies found typical daily pipeline velocity of roughly $4,500 to $7,000 for SMB-focused teams, $12,000 to $18,000 for mid-market, and $25,000 to $50,000 for enterprise, with top-quartile companies in each band running at about 2.5 times the velocity of the bottom quartile. General B2B win rate benchmarks sit around 20% on average, with top performers clearing 30% or higher, which lines up with why the gap between average and top-quartile teams keeps showing up across every version of this data.
How to actually calculate and improve your own number?
Most teams don't need an external benchmark so much as a consistent internal one. Pull qualified opportunity count, average deal size, and win rate from closed deals over a trailing 90-day window, divide by average cycle length across that same window, and track the resulting number monthly. When velocity drops, the fix isn't to guess, it's to check the four inputs in order: are fewer qualified opportunities entering the pipeline, is win rate slipping, are deals sitting untouched in the middle stages, or has average deal size quietly shrunk. A 10-point improvement in win rate tends to move velocity more than a 20% increase in raw pipeline volume, because it compounds across every deal already in motion rather than just adding more deals to a slow-moving system.
The unglamorous part of that diagnosis is usually where deals actually die: not in a dramatic loss, but in silence, sitting in a stage nobody followed up on because the lead came in through a channel that never made it into the pipeline cleanly, or because the rep lost track of who else on the buying committee needed to be looped in.
Where Pixelwand CRM fits in
Pipeline velocity only improves when the friction between "a deal exists" and "someone is actively moving it forward" gets removed. Pixelwand CRM unifies leads and deals from calls, WhatsApp, web forms, and email into one pipeline automatically, so opportunities don't sit unnoticed in a channel nobody is checking while a competitor's rep calls back first. Native two-way WhatsApp Business API messaging and click-to-call via Twilio live directly on the deal record, which matters for the 50-day cutoff data above, since every extra day a deal sits waiting for a reply is a day working against the win rate.
Assignment rules and custom statuses make it easier to see exactly which stage a deal has stalled in, which is the first diagnostic step in any velocity investigation. Gmail and Outlook sync auto-logs every email thread on the record, and Slack notifications flag deal and task activity in real time, so a stakeholder going quiet for a week shows up as a signal instead of getting lost until the next pipeline review. None of that changes deal size or market win rates on its own, but it removes the avoidable delay that turns a winnable 45-day deal into a 90-day one.
Quick answers
Speed predicts winning, not just timing. Deals closing within 50 days win near 47%, versus about 20% past that mark.
Win rates and cycles are squeezing velocity. Average win rates fell toward 19% while cycles stretched, hitting both sides of the formula.
Benchmark against your own trend. Segment velocity differs too much by deal size for one fixed target to mean much.
Sources: PipelineGrader, Gradient Works, ZenitData, ORM, Salesmotion, Optifai, PandaDoc, Factors.ai
Learn the sales pipeline math behind a revenue target, from deals needed to leads and weekly activity, with a free calculator you can use now.
Upsell and cross-sell statistics show existing customers convert 60-70% of the time, versus just 5-20% for new prospects, per Marketing Metrics research.
Multichannel sales outreach statistics show social beats email 42% to 26%, and buyers now use 10 channels per deal, per HubSpot and McKinsey.
Frequently asked questions
How do you calculate sales pipeline velocity?
The standard formula is: Pipeline Velocity equals (Number of Qualified Opportunities multiplied by Average Deal Size multiplied by Win Rate) divided by Average Sales Cycle Length in days. The result is expressed as revenue per day, so a velocity of $2,000 a day means your pipeline is generating roughly $2,000 in expected closed revenue every day. Most teams pull opportunity count, deal size, and win rate from closed deals over a rolling 90-day window, then divide by average cycle length for that same window so all four inputs reflect the same period.
What is a good pipeline velocity benchmark?
There is no single healthy number, since velocity is driven heavily by deal size and industry, but segment data offers a rough guide. One 2025 study of 423 B2B SaaS companies found SMB velocity typically lands between $4,500 and $7,000 a day, mid-market between $12,000 and $18,000 a day, and enterprise between $25,000 and $50,000 a day. The more useful benchmark for most teams is their own trailing quarter, since a consistent quarter over quarter increase matters more than matching an industry average.
Why is pipeline velocity declining across B2B sales teams?
The 2025 Ebsta x Pavilion GTM Benchmarks, based on 655,000 opportunities and $48 billion in pipeline, found the average win rate fell to 19% from 29% the prior year, while sales cycles have lengthened by roughly 22% since 2022. Since win rate and cycle length are two of the four levers in the velocity formula, a falling win rate combined with a longer cycle compresses velocity even when teams are generating more total pipeline.
Does deal speed actually affect whether you win the deal, or just how fast you find out?
Speed itself appears to influence the outcome, not just the timeline. The same 2025 Ebsta x Pavilion dataset found deals that closed within 50 days won at close to 47%, while deals that dragged past 50 days won at only around 20%. Delayed deals reduce win rates by roughly 113%, while getting the economic decision maker involved early lifts win rates by about 55%, suggesting momentum and stakeholder engagement compound rather than just correlate with speed.