Pipeline Coverage Ratio: A Practical Guide
Understand pipeline coverage ratio, how win rate changes the number, and how to turn a revenue target into a qualified pipeline plan for your team.
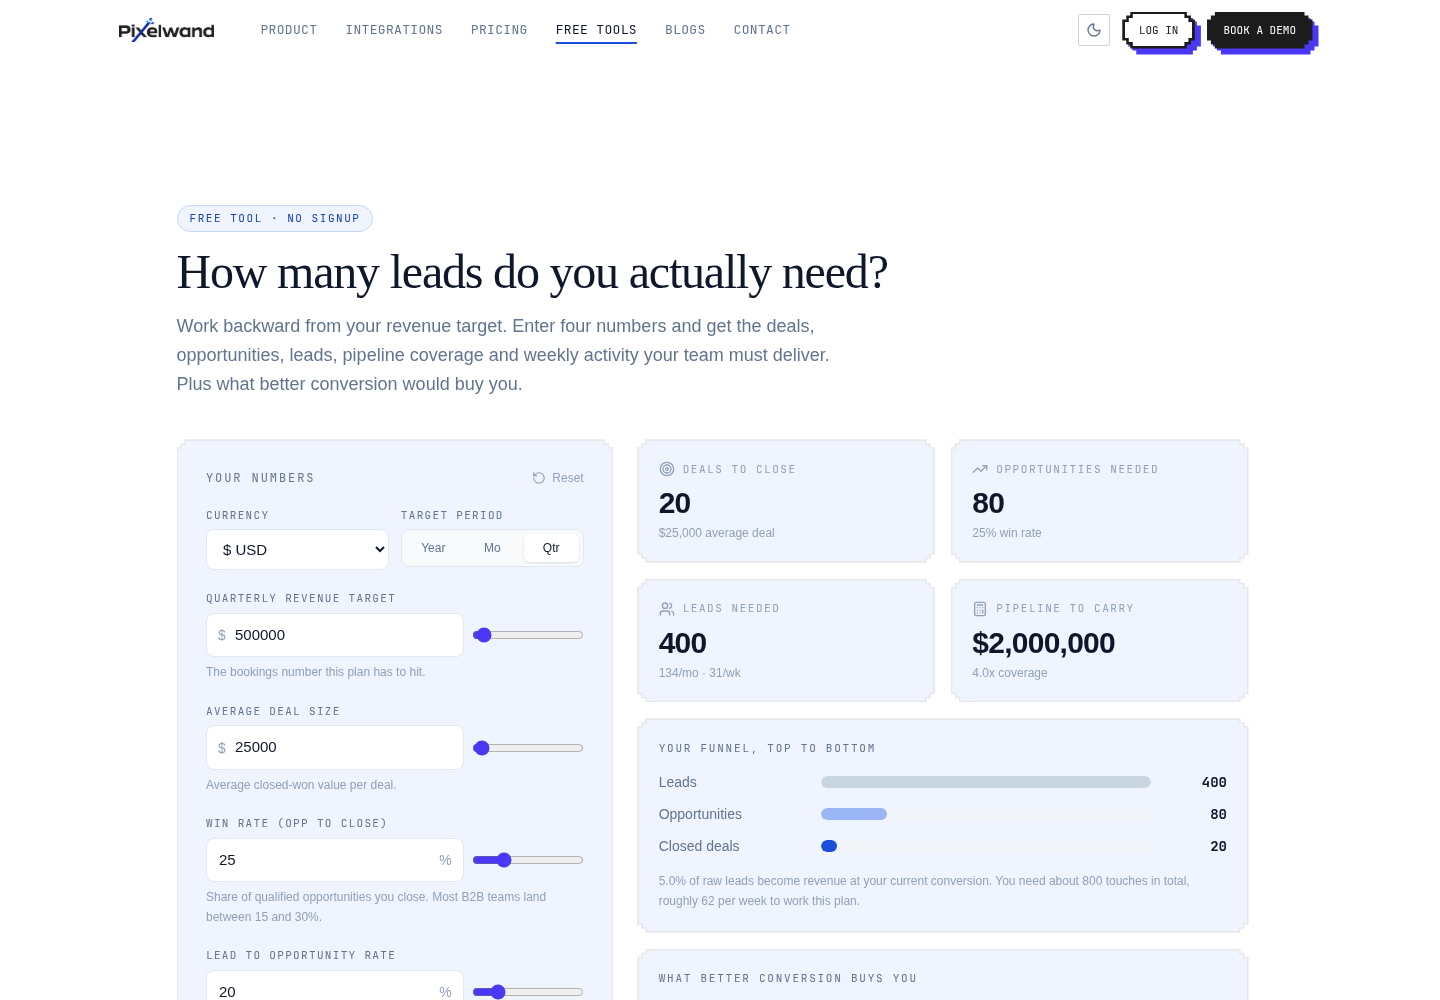
TL;DR: Pipeline coverage ratio is qualified open pipeline divided by the revenue target. A 25% historical win rate implies roughly 4x coverage, but the right ratio depends on your real conversion data and how strictly your team defines a qualified opportunity. Test your assumptions in the free sales pipeline calculator.
What does pipeline coverage ratio mean?
Pipeline coverage answers one question: how much opportunity value do you need to carry to have a realistic path to the target? The formula is qualified open pipeline ÷ revenue target. If your team has $1.5 million in qualified pipeline and a $500,000 quarterly target, coverage is 3x.
The word “qualified” matters. A list of every opportunity ever created is not a forecastable pipeline. Coverage should normally include open deals with a defined need, a next step, an owner, and a plausible close date.
How does win rate determine the ratio?
Win rate provides the first approximation. If 25% of qualified opportunities close, each dollar of target requires about four dollars of qualified pipeline. At a 20% win rate, that rises to five dollars. At a 40% win rate, it falls to 2.5x.
That inverse relationship is useful because it shows where to focus. If coverage is too high, creating more leads may not be the best answer. Better qualification, stronger discovery, or faster follow-up may raise win rate and reduce the amount of pipeline the team must create.
What makes a coverage ratio misleading?
Coverage is misleading when the denominator and numerator describe different time periods. Do not compare a full-year target with this month’s pipeline, or a bookings target with a pipeline measured in total contract value unless your definitions match.
It also breaks when late-stage deals are not moving. A deal with no next activity may still count toward a report, but it should not receive the same forecast weight as an opportunity with a scheduled meeting and confirmed buying process. Add stage aging and next-step hygiene to your coverage review.
How should a sales leader set a coverage target?
Start with the team’s trailing two or three quarters. Calculate coverage and actual attainment for each period. Then segment by source, rep, deal size, and stage. A single blended ratio often hides the fact that inbound opportunities convert at a different rate from outbound opportunities.
Use the calculator to model conservative and expected win rates. The output includes opportunities, leads, pipeline, and weekly activity, so you can see whether the target is a coverage issue or a capacity issue. Share the plan with reps instead of keeping it inside a spreadsheet.
Curious how this looks with your own pipeline?
15-minute walkthrough, no pressure, cancel anytime.
Where Pixelwand CRM fits in
Pixelwand CRM gives managers a live view of leads, deals, activities, and next steps rather than a snapshot assembled for a meeting. Calls, WhatsApp, web forms, and email can be tied back to the same record, while custom statuses and saved views help teams inspect the parts of pipeline that are creating or losing coverage. Learn more about pipeline visibility in Pixelwand.
Sources: Pixelwand Sales Pipeline Calculator, Pixelwand CRM Features
Pipeline coverage stats: the classic 3x rule misfires once win rate, aging, and data quality factor in, with teams needing 2x to 6x.
Learn the sales pipeline math behind a revenue target, from deals needed to leads and weekly activity, with a free calculator you can use now.
Pipeline velocity stats: average B2B win rate fell to 19% in 2025, and deals closing in 50 days win at 47% versus 20% slower.
Frequently asked questions
What is a good pipeline coverage ratio?
There is no universal ratio. A starting point is the inverse of your historical win rate: 4x at 25%, 5x at 20%, and 3.33x at 30%. Adjust for deal quality, stage definitions, and sales-cycle length.
How do I calculate pipeline coverage?
Divide qualified open pipeline value by the revenue target for the same period. A $2 million qualified pipeline against a $500,000 target is 4x coverage.
Does more pipeline always mean a better forecast?
No. Pipeline value only helps when opportunities are qualified, active, and distributed across the period. Stale deals and duplicate opportunities inflate coverage without improving the forecast.