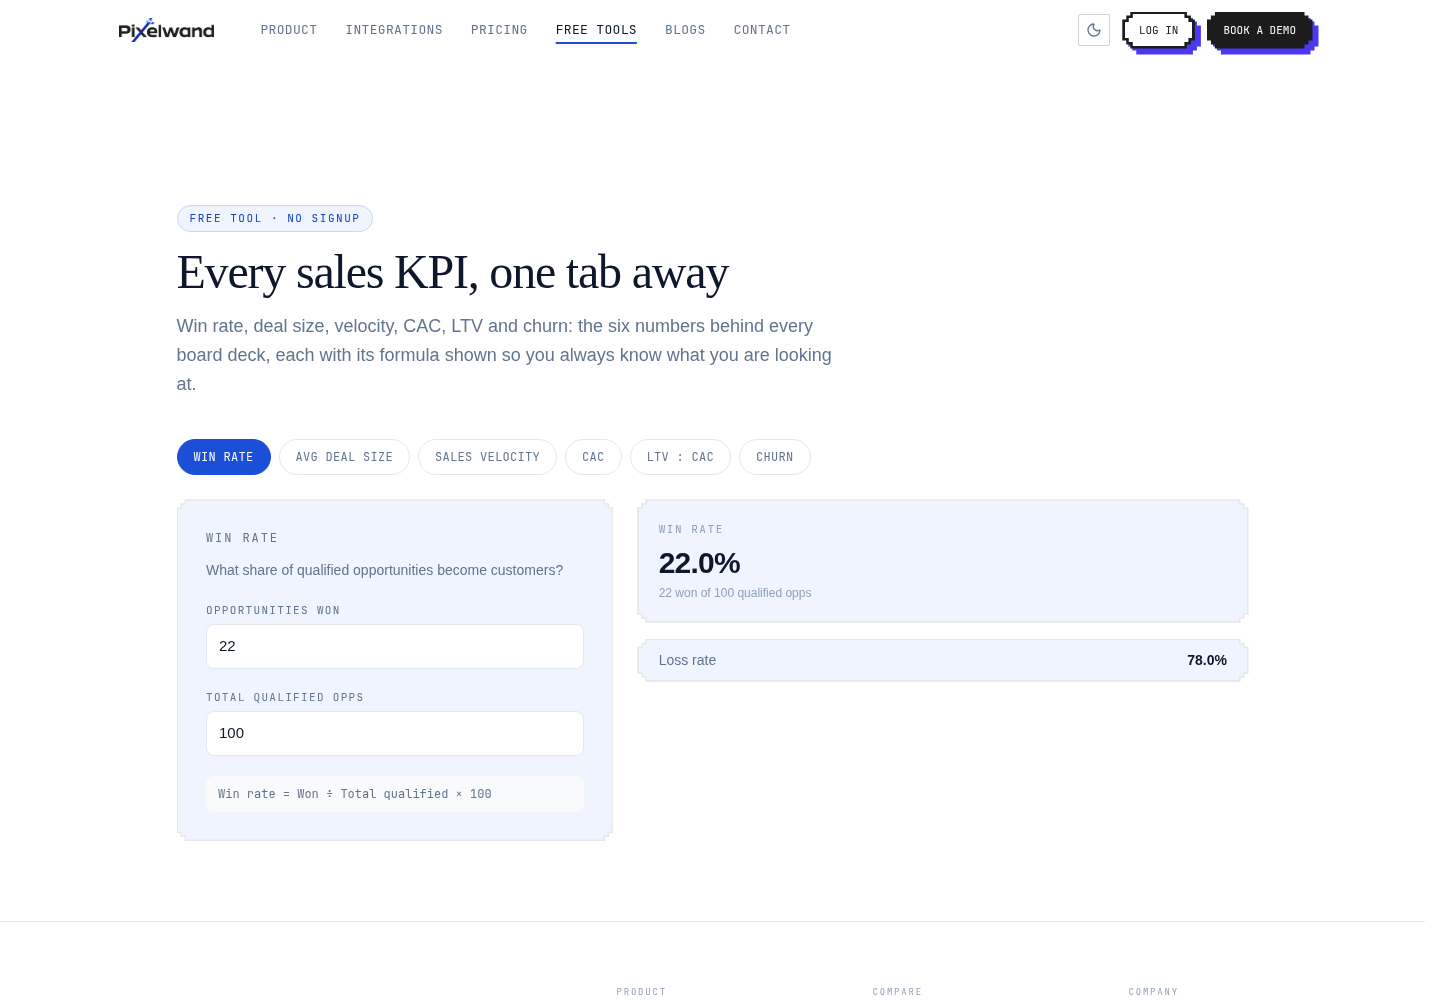
Sales Metrics Calculator: Six KPIs Explained
Use six practical sales metrics, including win rate, velocity, CAC, LTV, and churn, with plain-English formulas and a free calculator.
TL;DR: A useful sales dashboard does not need dozens of numbers. Start with win rate, average deal size, sales velocity, CAC, LTV, and churn. The free sales metrics calculator shows the formula for each so your team can discuss the same numbers.
Which six sales metrics matter most?
The six metrics answer three questions: can you win demand, can you move it quickly, and is the resulting customer economics healthy? Win rate and average deal size describe conversion. Sales velocity combines conversion with time. CAC, LTV, and churn show whether growth is efficient and durable.
Use the same period and segment when comparing metrics. A monthly CAC next to an annual LTV can be useful after normalization, but a quarterly win rate mixed with a year-to-date sales cycle can create false confidence.
How do you calculate win rate and deal size?
Win rate is won opportunities divided by closed opportunities, using a clearly defined period. Do not divide wins by every opportunity ever created. Average deal size is total won revenue divided by won deals. Track median deal size as well when one enterprise contract can distort the average.
These two metrics explain different problems. A strong win rate with a shrinking deal size may leave revenue flat. A larger average deal with falling win rate may create a pipeline that looks valuable but is hard to close. Read them together.
What does sales velocity measure?
Sales velocity estimates expected revenue movement per day. A common formula is qualified opportunities × average deal size × win rate ÷ average sales-cycle length. It is useful because it combines volume, value, conversion, and speed rather than rewarding a team for simply creating more opportunities.
When velocity falls, inspect each input. Fewer qualified opportunities suggests demand or qualification trouble. Lower win rate suggests positioning, discovery, or stakeholder issues. A longer cycle suggests stalled next steps or a more complex buying process.
How do CAC, LTV, and churn work together?
Customer acquisition cost is sales and marketing cost divided by new customers. Lifetime value estimates the gross profit a customer generates over the relationship. Churn measures the customers or revenue lost during a period. LTV is only useful when its definition includes margin and an explicit time or retention assumption.
The ratios are directional, not magic thresholds. A team can improve LTV-to-CAC by reducing churn, improving onboarding, raising margin, or lowering acquisition cost. Use trends by segment to find the lever instead of chasing a single benchmark.
Curious how this looks with your own pipeline?
15-minute walkthrough, no pressure, cancel anytime.
Where Pixelwand CRM fits in
Metrics are only as trustworthy as the records behind them. Pixelwand brings calls, WhatsApp messages, web forms, and email into connected lead and deal records, reducing the missing activity that makes a pipeline report unreliable. Use the sales metrics calculator for the formulas and Pixelwand CRM for the operating history behind them.
Sources: Pixelwand Sales Metrics Calculator, Pixelwand CRM Features
Frequently asked questions
Which sales metrics should a small team track?
Start with win rate, average deal size, sales velocity, customer acquisition cost, lifetime value, and churn. Track definitions consistently before adding more dashboard metrics.
What is sales velocity?
Sales velocity estimates the value moving through the pipeline per day. A common formula is opportunities multiplied by average deal size and win rate, divided by average sales-cycle length.
Why do sales metrics need shared definitions?
A metric changes meaning when teams use different periods, stage definitions, or revenue values. Shared definitions make trends comparable and prevent a dashboard from hiding operational problems.